Reports
Reports are tiles that summarize one table. They can show markdown, a single value, a gauge, an aggregate table, or a chart.
Admins create reports from Table Settings -> Reports. Every workspace member who can open the table can view its reports and copy useful ones to their home page.
Create a report
- Open a table.
- Open table settings.
- Choose Reports.
- Click Create New Report.
- Pick a report type, configure aggregation and filters, then save.
The editor shows a live preview before saving.
Report types
- Markdown: static notes, links, instructions, or context.
- Value: one number, such as count, sum, average, minimum, or maximum.
- Gauge: one value shown against a maximum.
- Table: grouped aggregate rows, such as count by status or sum by owner.
- Charts: horizontal bar, vertical bar, line, area, or pie.
Sorting chart data
Grouped charts have a Sort by option: order by the group (e.g. date, ascending or descending) or by the aggregated value (high→low or low→high). Line and area charts default to ordering by the group, so a chart grouped by date reads left-to-right in chronological order and shows a true trend. Bar and pie charts default to ranking by value (highest first). Switch the option any time to re-order.
Filters
Reports can filter source records by table fields. Filter values are bound safely; users do not write raw SQL.
Available comparisons include equals, not equals, greater/less than, contains, starts with, ends with, is empty, and is not empty.
Relative dates
When you filter on a date field, you can pick a relative value instead of a fixed calendar date — for example "30 days ago", "start of this month", or a custom amount like 7 days, 2 weeks, 3 months, or 1 year in the past or future. Relative filters are recalculated every time the report runs, so a chart set to "last 30 days" always shows a rolling window rather than freezing on the day you created it. This keeps trend charts (like line charts) fast and meaningful on tables with lots of historical data.
Choose Specific date in the picker if you'd rather pin an exact calendar date.
Data Page Rail
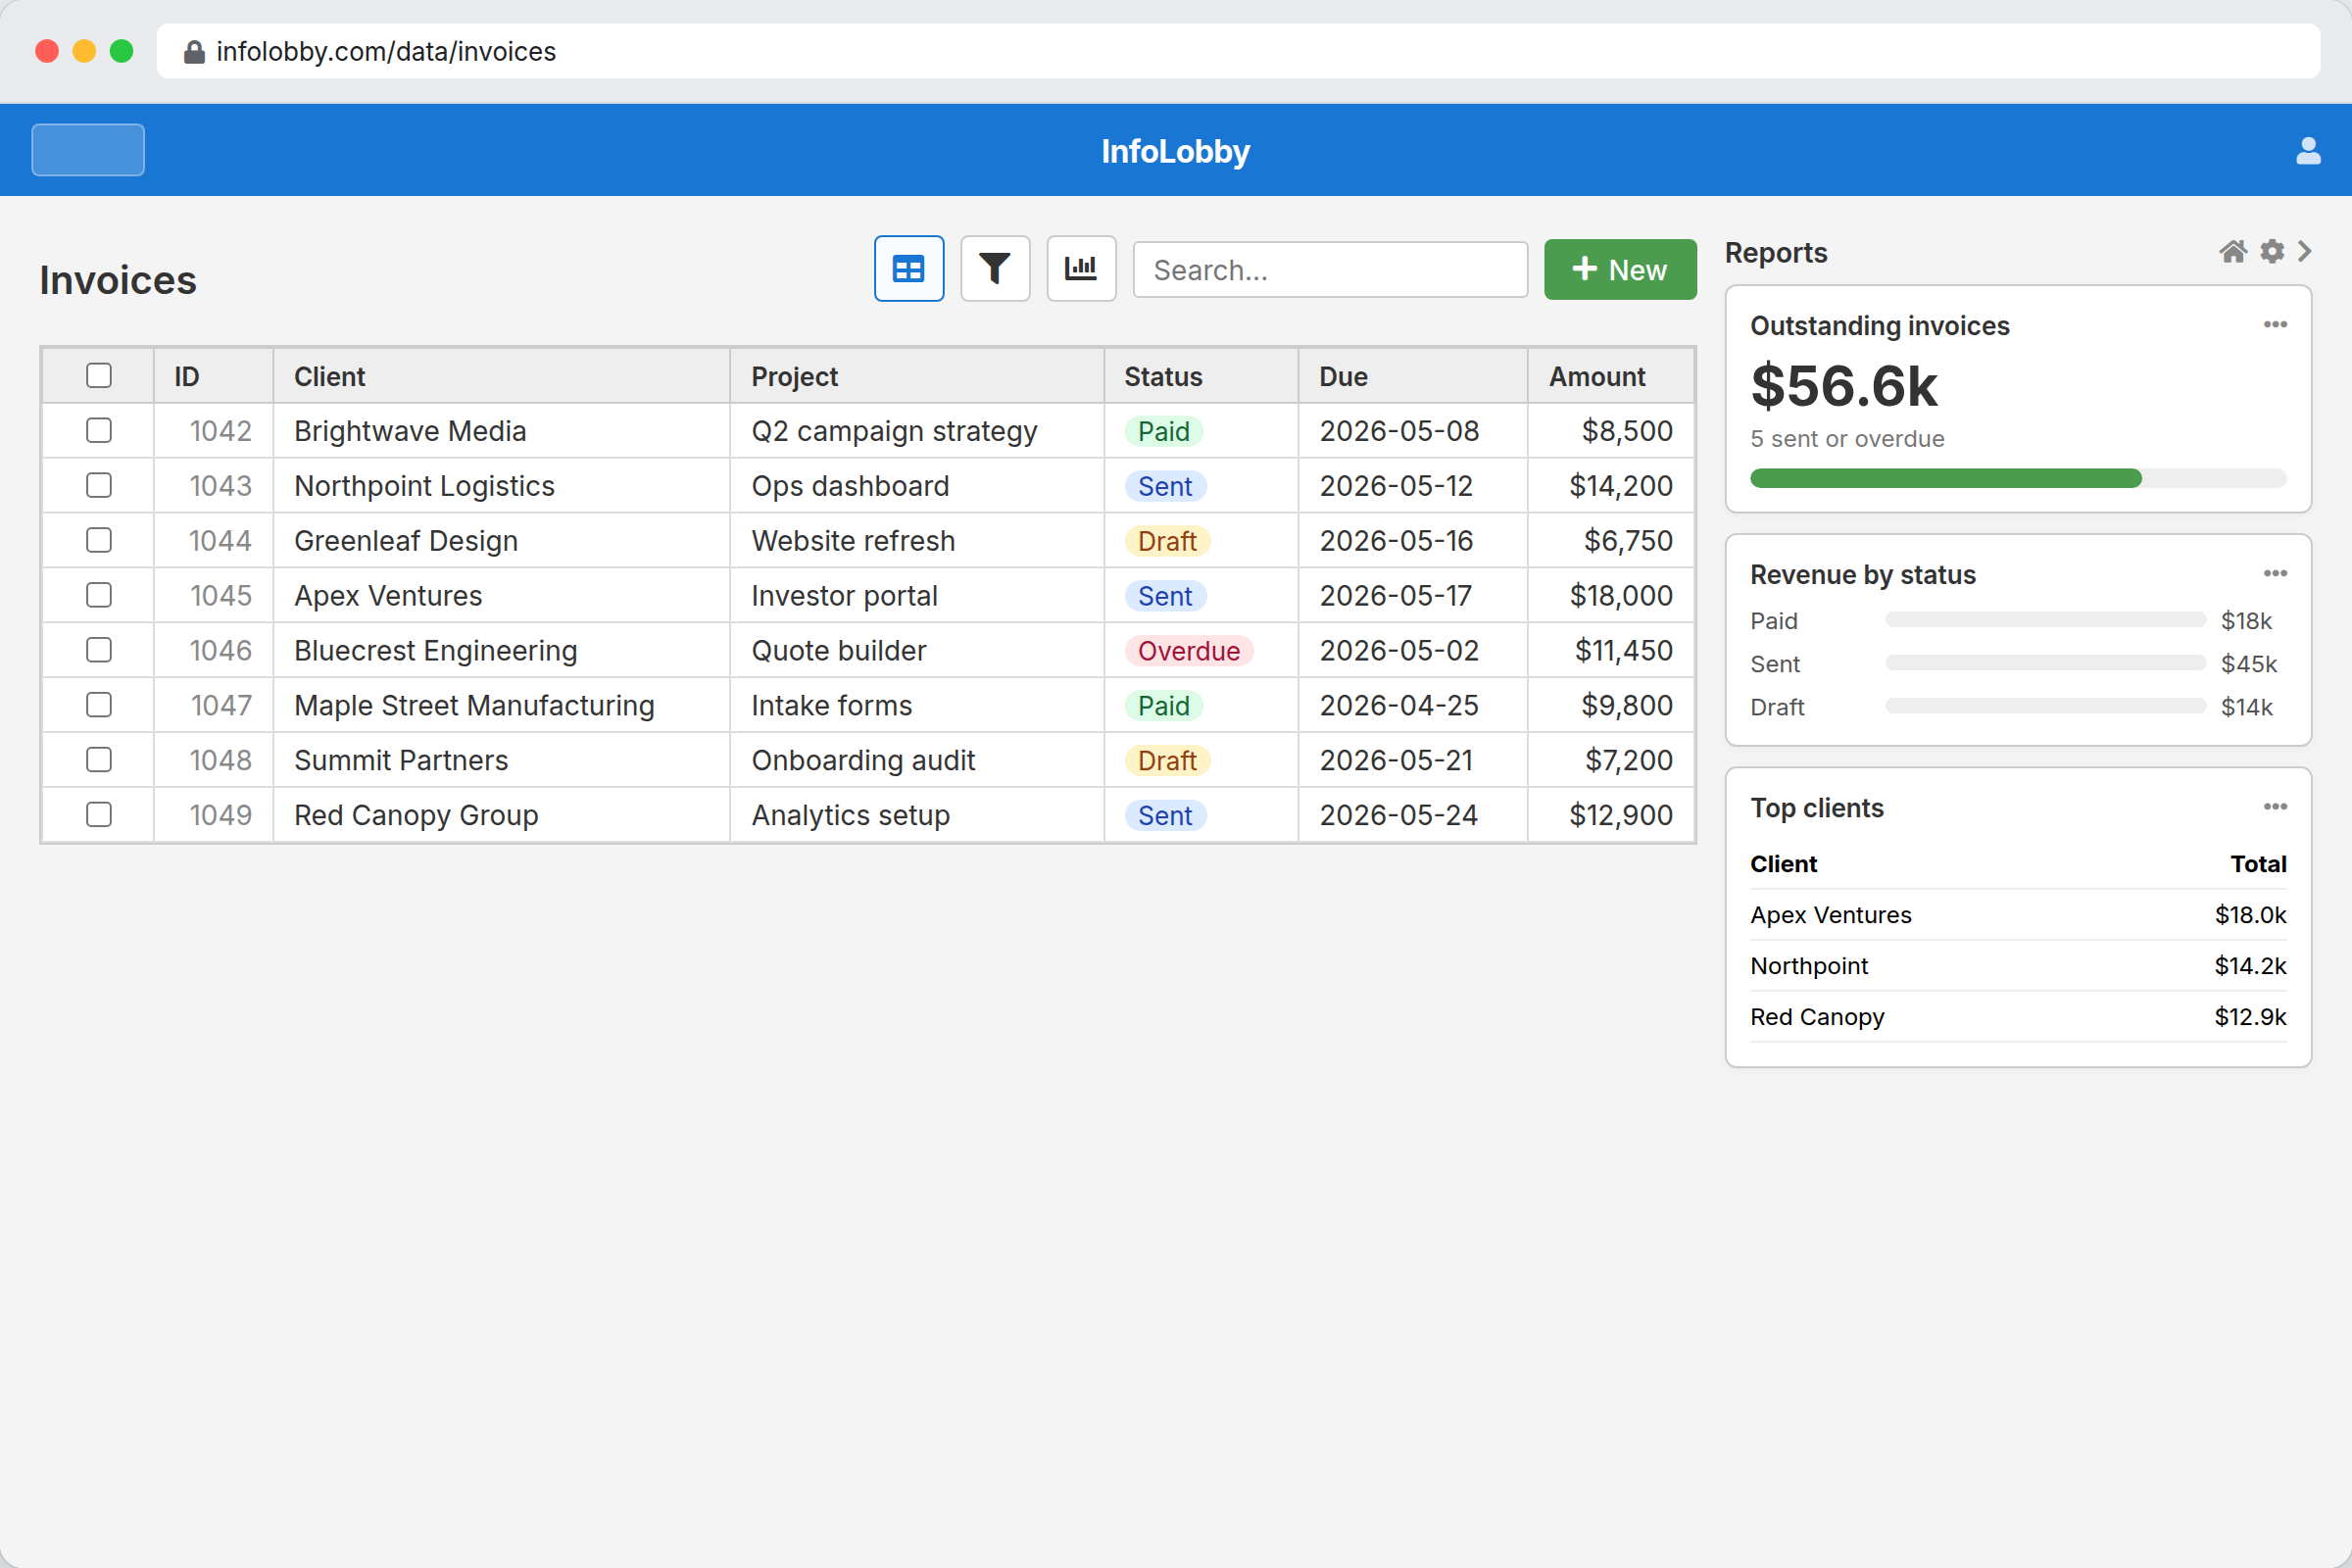
Saved reports appear in a right rail on the table data page on wider screens. Use the tile menu to copy a report to your home page. Admins also see an edit link back to the Reports tab.
Click a tile — a value, a progress bar, or a chart segment — to drop into the grid showing just the records behind it. The report's filters (including any OR conditions) carry over to the grid filter panel, so you see the same record set the report counted. Reload the page to return to your normal view.
Home Page Reports
Copied reports appear on your home page as live references. If an admin edits the source report, your pinned copy updates. If the source report is deleted or you lose access to the table, it disappears from your home page.
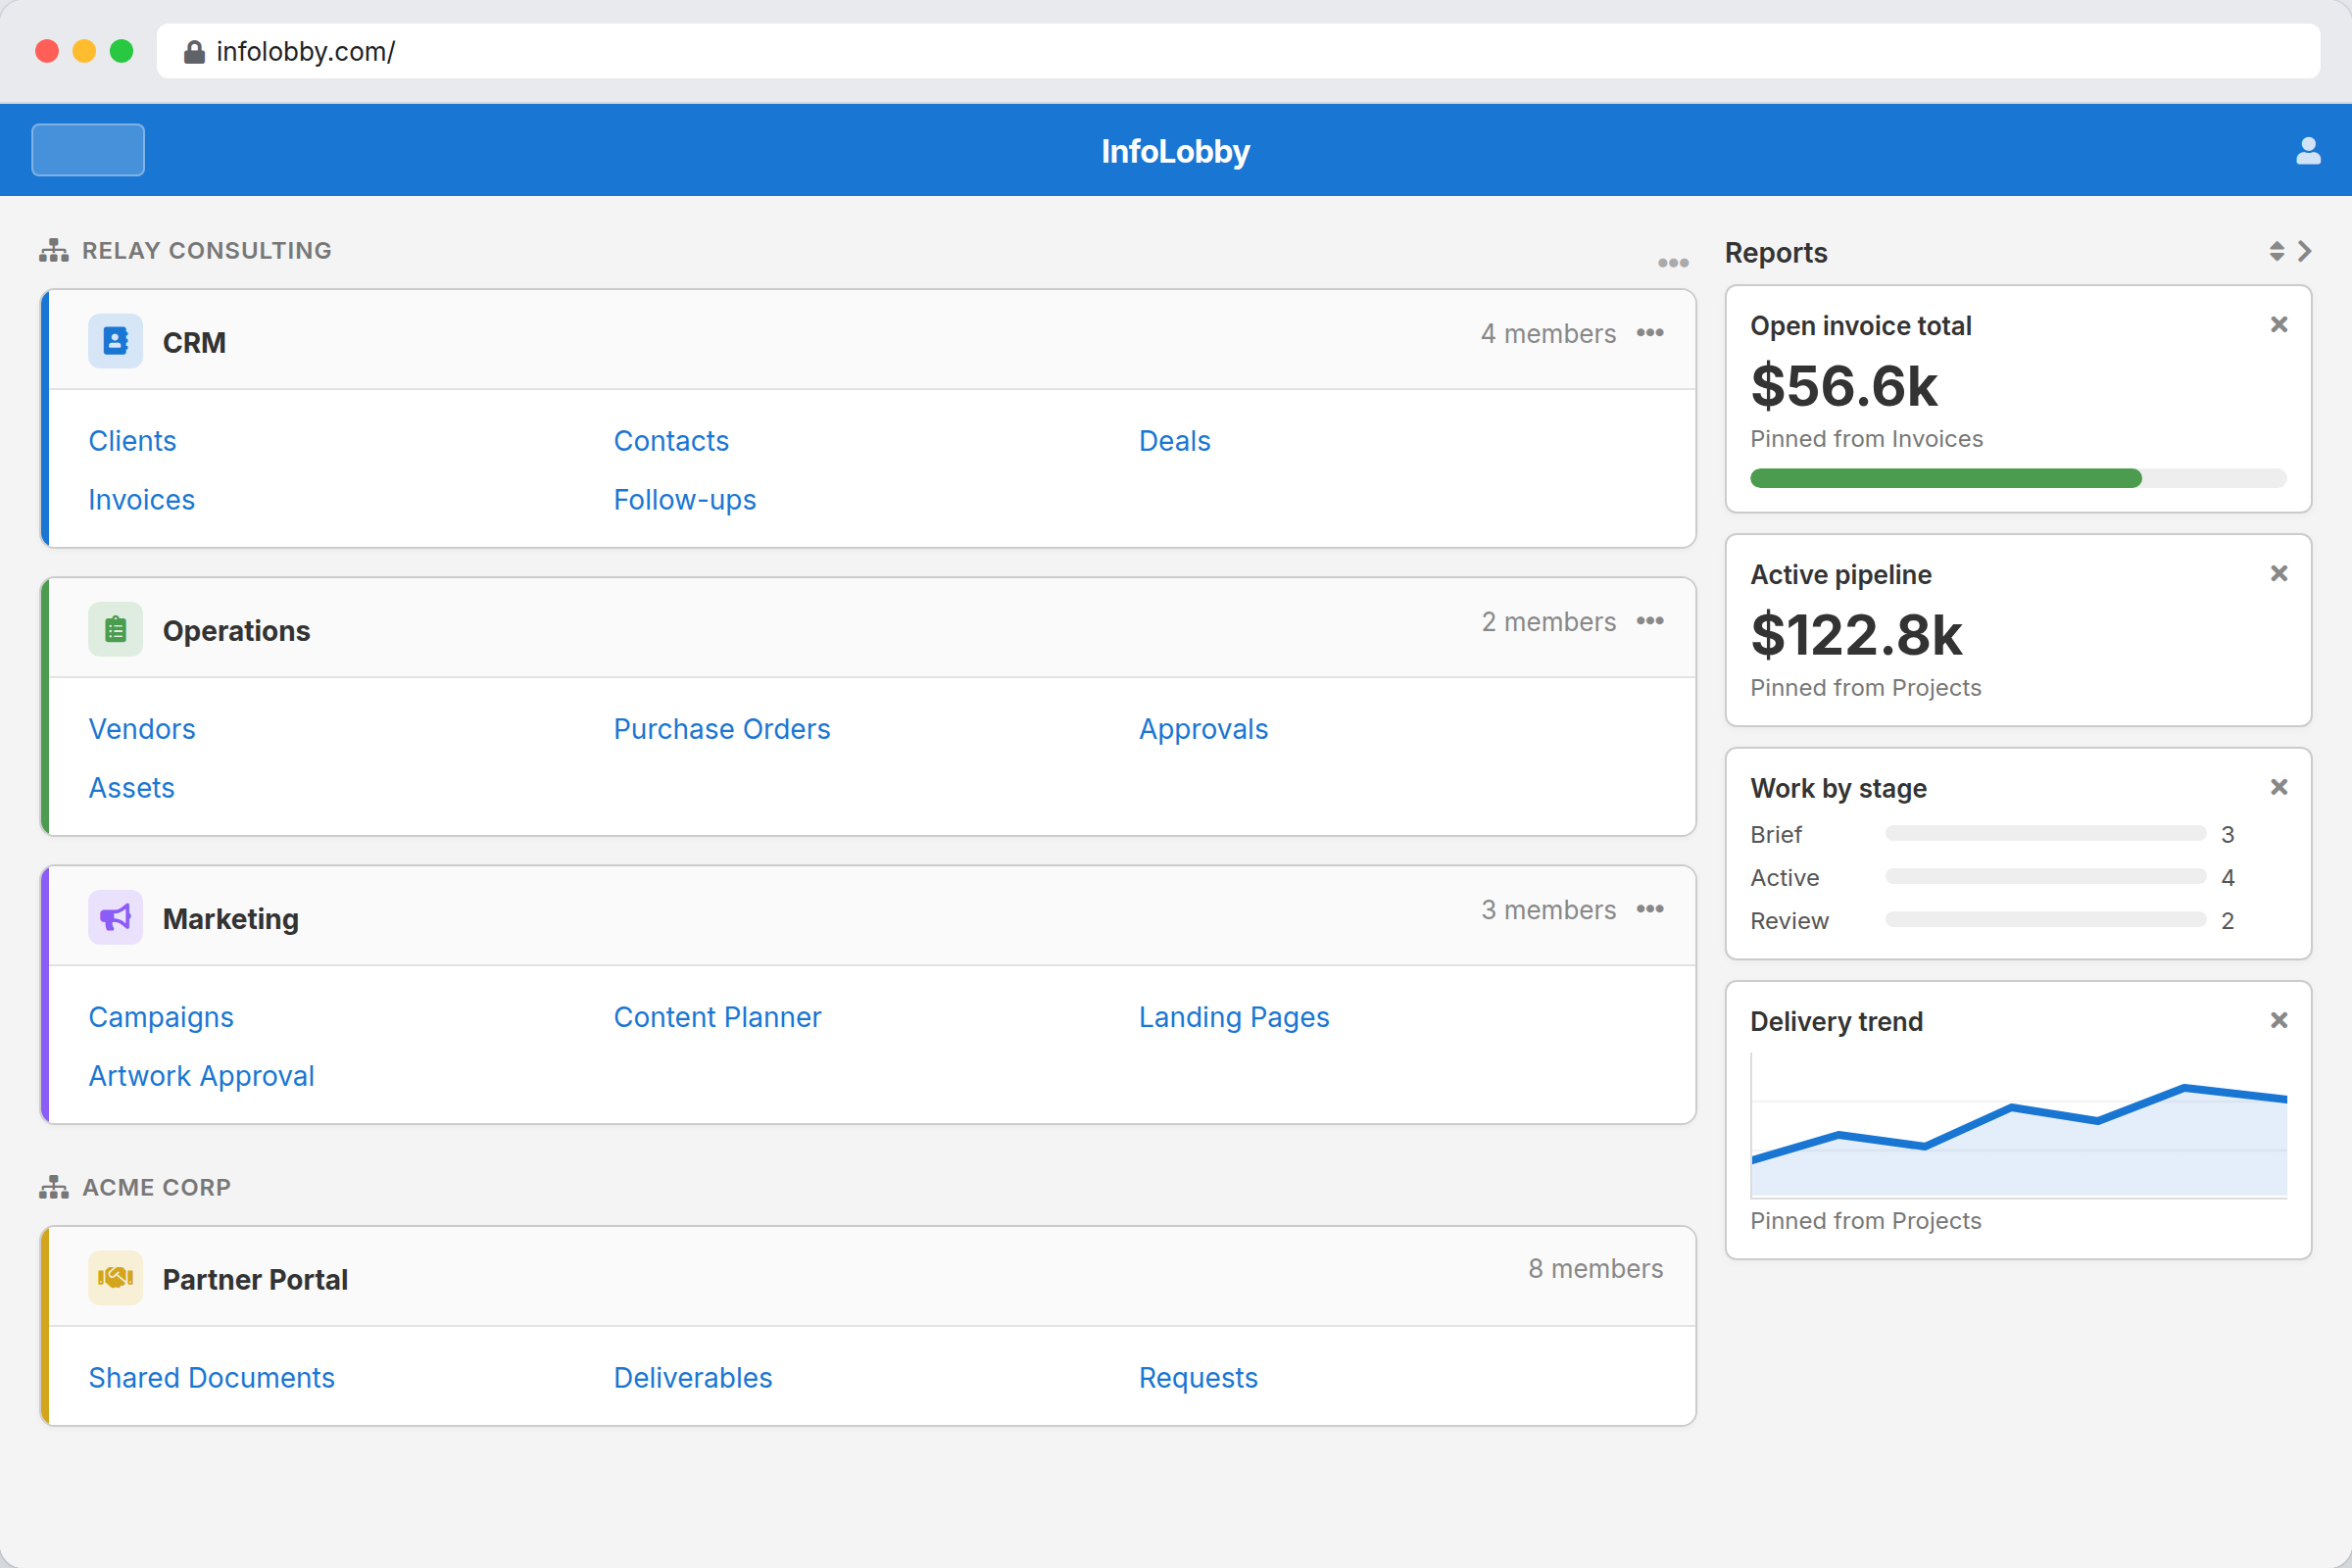
You can reorder or remove pinned reports from the home-page tile menu.